Document Type : Original Research Paper

Authors

1 Ph.D. in Architecture, Kish International Campus, University of Tehran, Kish, Iran.

2 Professor, College of Fine Arts, University of Tehran, Tehran, Iran.

3 Professor, Faculty of Psychology and Educational Sciences, Shiraz University, Shiraz, Iran.

Abstract

Extended Abstract
Background and Objectives: Thermal comfort is one of the comfort aspects in current architectural design and can be changed by various components. Researchers emphasize that early thermal comfort studies relying on climate and environmental aspects can only justify a  part of the results. Therefore, it is necessary to examine the effect of other components. Effective components could be found in physical, physiological, psychological, social, environmental, and economic aspects. So, thermal comfort can be influenced by inner and outer factors. Regarding the research literature and the variety of effective components in thermal comfort, there is a lack of research on this subject. In addition, researchers believe many relations between these components should be considered in thermal comfort studies. Therefore, as a part of a larger study, this study was conducted to investigate the effect of personal, environmental, and social components on thermal comfort. This study aims to clarify the individual and social components affecting the perception of thermal comfort to provide solutions to improve the design of office spaces. So, there are two questions: First, what are the personal and social factors affecting the perception of thermal comfort? And second, which scale is better for predicting thermal comfort based on these components?
Methods: In this regard, a field study (including questionnaire, observation, and on-site measurement for recording climatic data using thermal sensors) was conducted in winter in a main administrative office building of Shiraz University. Questionnaires were designed to gather some of the personal components (such as age, gender, height, weight, and adaptive behaviors); social components (including education and degree level, the field of study, and position); and thermal scales (thermal sensation, thermal comfort, thermal satisfaction, thermal preference, thermal acceptability, and overall thermal comfort). Blood pressure, heart rate, and body temperature as the personal components were measured using a related standard device. Clothing and activity types were recorded and then changed into a quantitative scale. The data loggers also record the indoor air temperature and relative humidity. The field study was conducted in January 2019 for four consecutive days from 8 am to 12 pm. In total, there were 110 measurement subjects. Finally, 108 were identified as useful in the analysis by eliminating incomplete questionnaires. The main administrative building is located on the northern side of Shiraz, Iran (52.52°N, 29.63°E). The 138920 m2 building is oriented in the northwest and southeast in two blocks (with seven and ten stores). The two building blocks have some differences in constructional details and interior design. There was no compulsion to participate, and oral and short-form written consent was considered with no restrictions on participants to have freedom of their usual work day.
Findings: The collected data were imported into SPSS software. A total of 22 statistical analyses were performed, including descriptive and inferential statistics (linear and multiple linear regression, Univariate ANOVA). This study selected the correlation coefficients based on the variables scale. So, Spearman, Pearson, and Eta correlation have been used to show the strength of the relations. In this study, 108 subjects participated, including 41 women and 66 men (one person did not mention gender). The age group varies from 24 to 60 years. Most of the age group is in the 31-45 range. These individuals weigh between 50 and 120 kg and have a height of 1.55 to 1.86 meters. The average body temperature was 36°C, the mean blood pressure was 126 with a minimum of 87 and a maximum of 183, and the heart rate was also in the range of 49 to 98. The average indoor air temperature during the four days of study was 23.67°C, and the average relative humidity was 24.86%. The indoor globe temperature was very close to the air temperature (23.50°C). The average outdoor temperature was 15.2°C, and the average relative humidity was 34.9%. The thermal response was considered with nine different thermal scales on the 3,5, and 7-point Likert scale. The average of each response was as follows: Thermal sensation vote (TSV)= -0.4; Thermal comfort=6; Thermal pleasure= 4.78; Temperature preferences= 0.3’ Humidity preferences= -0.18; Velocity preferences= -0.35; Radiation preferences=-0.32; Thermal acceptance= 0.85; & overall thermal comfort= 4.94.
Conclusion: The results show that the impact of social components is negligible. However, participants in double and multiple office rooms had better thermal comfort status than in single office rooms. So, if these criteria are considered during the design process, it can help to improve the indoor environmental quality. Regarding the personal components, body mass index and clothing value are the two most influential factors. It is very important to make different thermal adaptation strategies for the occupants to have a right to choose any of them. Therefore, appropriate strategies should be considered for the components needed to provide comfortable conditions in both human resource management and architectural design. In this study, the thermal preference is an appropriate scale for predicting occupants’ thermal needs based on environmental and personal components. The thermal comfort range was calculated based on Griffith’s methods and was 21-26°C. It is very important to know that people feel neutral based on the thermal sensation vote in most office buildings. Still, they usually need temperature, humidity, air velocity, and radiation changes. So in architecture or mechanical engineering, we should not merely rely on thermal sensation vote to decide on heating or cooling setpoints. So, if the setpoint of the studied office building changes from 25°C to 23.6°C, we can anticipate at least a 10 percent reduction in energy consumption. People can adapt to different situations, making them flexible and resilient. But designers should be aware that this adaptation process needs more effort and, of course, more mental, psychological, and physical energy that can reduce occupant’s productivity.
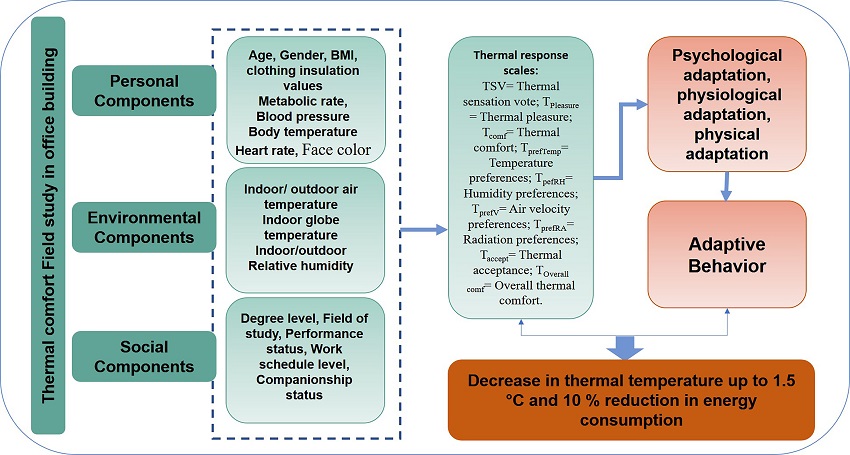
 

Graphical Abstract

Identification and assessment of the effect of environmental, personal and social components on thermal comfort in office buildings

Highlights

- Despite the application of thermal comfort standards, occupant’s dissatisfaction and unproductivity show that there is a need to consider the impact of other components in addition to environmental components.
- The effect of social components on a personal thermal comfort perception is negligible.
- Thermal preference can be predicted based on personal and environmental components. Accordingly, the average preferred temperature of in this study is 23.6 °C.

Keywords

این مقاله برگرفته از رساله دکتری نویسنده نخست با عنوان «مطالعه آسایش حرارتی در کاربری اداری با نگاهی بر مولفه‌های روانشناختی» می‌باشد که به راهنمایی نویسنده دوم و مشاوره نویسنده سوم در دانشگاه تهران پردیس بین‌المللی کیش انجام گرفته است.

This article is derived from the first author`s Doctoral thesis entitled “Thermal Comfort in office Building Considering Psychological Factor”, supervised by the second author and advised by the third, at University of Tehran Kish International Campus.

  1. Ali-Toudert, F. (2005). Dependence of Outdoor Thermal Comfort on Street Design in Hot and Dry Climate. Berichte Des Meteorologischen Institutes Der Universität Freiburg, Nr. 15(15).
  2. Aljawabra, F., & Nikolopoulou, M. (2010). Influence of hot arid climate on the use of outdoor urban spaces and thermal comfort: Do cultural and social backgrounds matter? Intelligent Buildings International, 2(3), 198–207.
  3. Auliciems, A. (1981). Towards a psycho-physiological model of thermal perception. International Journal of Biometeorology, 25(2), 109–122.
  4. Barthelmes, V. M., Andersen, R. K., Heo, Y., Knudsen, H., Fabi, V., & Corgnati, S. P. (2018). Introducing thermal comfort attitudes, psychological, social and contextual drivers in occupant behaviour modelling with Bayesian Networks. In WiNDSOR Conference, Rethinking Comfort (p. 972).
  5. Brager, G. S., & De Dear, R. (1998). Thermal adaptation in the built environment : a literature review. Energy and Buildings, 27, 83–96.
  6. Candido, C., & Dear, R. De. (2012). From thermal boredom to thermal pleasure: a brief literature review. Ambiente Construído, 12(1), 81–90.
  7. Chappells, H., & Shove, E. (2007). sustainability , energy consumption and the indoor environment Debating the future of comfort : environmental sustainability , energy consumption and the indoor environment, (May 2015), 37–41.
  8. Chen, L., & Ng, E. (2012). Outdoor thermal comfort and outdoor activities: A review of research in the past decade. Cities, 29(2), 118–125.
  9. Cheung, P. K., & Jim, C. Y. (2017). determination and application of outdoor thermal benchmarks. Building and Environment.
  10. Chung, M. S. C., & Lau, K. K. L. (2018). Effects of environmental perception on thermal sensation in sub-tropical and high-density cities: a case study of Hong Kong. In WiNDSOR Conference, Rethinking Comfort (p. 506).
  11. Cohen, P., Potchter, O., & Matzarakis, A. (2013). Human thermal perception of Coastal Mediterranean outdoor urban environments. Applied Geography, 37, 1–10.
  12. D’Oca, S., Chen, C. F., Hong, T., & Belafi, Z. (2017). Synthesizing building physics with social psychology: An interdisciplinary framework for context and occupant behavior in office buildings. Energy Research and Social Science, 34(April), 240–251.
  13. Damiati, S. A., Zaki, S. A., Rijal, H. B., & Wonorahardjo, S. (2016). Field study on adaptive thermal comfort in office buildings in Malaysia, Indonesia, Singapore, and Japan during hot and humid season. Building and Environment, 109, 208–223.
  14. De Dear, R. J., Akimoto, T., Arens, E. A., Brager, G., Candido, C., Cheong, K. W. D., & Toftum, J. (2013). Progress in thermal comfort research over the last twenty years, 442–461.
  15. De Dear, R., Brager, G., & Cooper, D. (1998). Developing an adaptive model of thermal comfort and preference: final report [on] ASHRAE RP-884. ASHRAE Transactions (Vol. 104).
  16. De Dear, Richard J, & Brager, G. S. (2002). Thermal comfort in naturally ventilated buildings: revisions to ASHRAE Standard 55. Energy and Buildings, 34(6), 549–561.
  17. Földváry, V., Cheung, T., Zhang, H., de Dear, R., Parkinson, T., Arens, E., ... &, & Li, P. (2018). Development of the ASHRAE Global Thermal Comfort Database II. Building and Environment, (June).
  18. Foo, J., & Mavrogianni, A. (2018). Seeing is Believing, or is it? An assessment of the influence of interior finish characteristics on thermal comfort perception at a University campus in a temperate climate. In WiNDSOR Conference, Rethinking Comfort.
  19. Frontczak, M., & Wargocki, P. (2011). Literature survey on how different factors influence human comfort in indoor environments. Building and Environment, 46(4), 922–937.
  20. Gunay, H. B., Brien, W. O., & Beausoleil-morrison, I. (2013). A critical review of observation studies , modeling , and simulation of adaptive occupant behaviors in offices. Building and Environment, 70, 31–47.
  21. Halawa, E., & Van Hoof, J. (2012). The adaptive approach to thermal comfort: A critical overview. Energy and Buildings, 51, 101–110.
  22. Heidari, S. (2014). "Thermal Adaptation in Architecture." Tehran: University of Tehran Press.
  23. Hong, T., & Yan, D. (2018). IEA EBC Annex 66 : A recently-completed international collaborative project, 28(2).
  24. Huizenga, C., Hui, Z., Duan, T., & Arens, E. (2005). An improved multinode model of human physiology and thermal comfort. Design, 9(2), 129–139.
  25. Humphreys, M. A., Roaf, S., & Nicol, F. (2016). Adaptive Thermal Comfort: Foundations and Analysis.
  26. Humphreys, M., & Nicol, F. (1998). Understanding the adaptive approach to thermal comfort. ASHRAE Transactions, 991–1004.
  27. Humphreys, M., & Nicol, J. F. (2018). Puzzles and paradoxes in adaptive comfort Michael. In WiNDSOR Conference, Rethinking Comfort (pp. 3–19).
  28. Jowkar, M., & Montazami, A. (2018). Thermal Comfort in the UK Higher Educational Buildings: The Influence of Thermal History on Students’ Thermal Comfort. In WiNDSOR Conference, Rethinking Comfort (p. 622).
  29. Kenawy, I., & Elkadi, H. (2013). The impact of cultural and climatic background on thermal sensation votes. PLEA 2013: Sustainable Architecture for a Renewable Future, (September), 1–6.
  30. Kim, Joyce, Zhou, Y., Schiavon, S., Raftery, P., & Brager, G. (2018). Personal comfort models : Predicting individuals ’ thermal preference using occupant heating and cooling behavior and machine learning. Building and Environment, 129(December 2017), 96–106.
  31. Kim, Jungsoo, & de Dear, R. (2018). Thermal comfort expectations and adaptive behavioural characteristics of primary and secondary school students. Building and Environment, 127(October 2017), 13–22.
  32. Knez, I., & Thorsson, S. (2006). Influences of culture and environmental attitude on thermal , emotional and perceptual evaluations of a public square, 258–268.
  33. Knez, I., & Thorsson, S. (2008). Thermal, emotional and perceptual evaluations of a park: Cross-cultural and environmental attitude comparisons. Building and Environment, 43(9), 1483–1490.
  34. Korsavi, S. (2018). Developing a Design Framework to Facilitate Adaptive Behaviours. Energy & Buildings.
  35. Korsavi, S. S., & Montazami, A. (2018). Adaptive Behaviours and Occupancy Patterns in UK Primary Schools: Impacts on Comfort and Indoor Quality. In WiNDSOR Conference, Rethinking Comfort.
  36. Maras, I., Buttstädt, M., Hahmann, J., Hofmeister, H., & Schneider, C. (2013). Investigating public places and impacts of heat stress in the city of Aachen, Germany. Erde, 144(3–4), 290–303.
  37. Mishra, A. K., & Ramgopal, M. (2013). Field studies on human thermal comfort — An overview. Building and Environment, 94–106.
  38. Montazami, A., Gaterell, M., Nicol, F., Lumley, M., & Thoua, C. (2017). Impact of social background and behaviour on children’s thermal comfort. Building and Environment, 122, 422–434.
  39. Nicol, F., Humphreys, M., & Olesen, Bj. W. (2004). A stochastic approach to thermal comfort - Occupant behavior and energy use in buildings, (January).
  40. Nicol, J. F., & Humphreys, M. A. (2002). Adaptive thermal comfort and sustainable thermal standards for buildings. Energy and Buildings, 34(6), 563–572.
  41. Nicol, J. Fergus, & Roaf, S. (2017). Rethinking thermal comfort. Building Research & Information, 0(0), 1–5.
  42. Nicol, J. Fergus. (2011). Adaptive comfort. Building Research and Information, 39(2), 105–107.
  43. Nikolopoulou, M., & Steemers, K. (2003). Thermal comfort and psychological adaptation as a guide for designing urban spaces. Energy and Building, 35(1), 95–101.
  44. Nikolopoulou, Marialena, Baker, N., & Steemers, K. (2001). Thermal comfort in outdoor urban spaces: Understanding the Human parameter. Solar Energy, 70(3), 227–235.
  45. Oliveira, S., & Andrade, H. (2007). An initial assessment of the bioclimatic comfort in an outdoor public space in Lisbon. International Journal of Biometeorology, 52(1), 69–84.
  46. Pantavou, K., Theoharatos, G., Santamouris, M., & Asimakopoulos, D. (2013). Outdoor thermal sensation of pedestrians in a Mediterranean climate and a comparison with UTCI. Building and Environment, 66, 82–95.
  47. Parkinson, T., de Dear, R., & Brager, G. (2020). Nudging the adaptive thermal comfort model. Energy and Buildings, 206(December 2019).
  48. Parsons, K. (2002). Human Thermal Environments. Taylor & Francis Group.
  49. Rijal, H. B., Humphreys, M. A., & Nicol, J. F. (2017). Towards an adaptive model for thermal comfort in Japanese offices. Building Research & Information, 1–13.
  50. Rupp, F. R., Dear, R. De, & Ghisi, E. (2018). Field study of mixed-mode office buildings in Southern Brazil using an adaptive thermal comfort framework. Energy & Buildings, 158, 1475–1486.
  51. Rupp, R. F., Kim, J., Ghisi, E., & de Dear, R. (2019). Thermal sensitivity of occupants in different building typologies: The Griffiths Constant is a Variable. Energy and Buildings, 200, 11–20.
  52. Schweiker, M., Abdul-Zahra, A., André, M., Al-Atrash, F., Al-Khatri, H., Alprianti, R., & R., ... & Azadeh, M. (2019). The Scales Project, a cross-national dataset on the interpretation of thermal perception scales. Scientific Data, 6(1), 1–10.
  53. Schweiker, Marcel, Fuchs, X., Becker, S., Shukuya, M., Dovjak, M., Hawighorst, M., & Kolarik, J. (2017). Challenging the assumptions for thermal sensation scales. Building Research & Information, 45(5), 572–589.
  54. Shooshtarian, S. (2015). Socio-economic Factors for the Perception of Outdoor Thermal Environments : Towards Climate-sensitive Urban Design. Global Built Environment Review, 9, 39–53.
  55. Shooshtarian, Salman, & Rajagopalan, P. (2017). Study of thermal satisfaction in an Australian education precinct. Building and Environment.
  56. Taleghani, M., Tenpierik, M., Van Den Dobbelsteen, A., & De Dear, R. (2013). Energy use impact of and thermal comfort in different urban block types in the Netherlands. Energy and Buildings, 67, 166–175.
  57. Thorsson, S., Lindqvist, M., & Lindqvist, S. (2004). Thermal bioclimatic conditions and patterns of behaviour in an urban park in Göteborg, Sweden. International Journal of Biometeorology, 48(3), 149–156.
  58. Van Hoof, J. (2008). Forty years of Fanger’s model of thermal comfort: Comfort for all? Indoor Air, 18(3), 182–201.
  59. Wagner, A., & Brien, W. O. (2018). Exploring Occupant Behavior in Buildings. Methods and Challenges.
  60. Wagner, A., & O’Brien, W. (2018). Occupant behaviour-centric building design and operation EBC Annex 79 October 2018 , updated after approval by IEA EBC Prepared by : Energy in Building and Communities Programme(EBC), (October).
  61. Wang, Z., Dear, R. De, Luo, M., Lin, B., He, Y., & Ghahramani, A. (2018). Individual Difference in Thermal Comfort : A Literature Review. Building and Environment, 138(June), 181–193.
  62. Williamson, T., & Daniel, L. (2018). Changing Thermal Comfort Expectations: Studies in Darwin, Australia. In WiNDSOR Conference, Rethinking Comfort (pp. 68–86).
  63. Wu, Z., Li, N., Cui, H., Peng, J., Chen, H., & Liu, P. (2017). Using Upper Extremity Skin Temperatures to Assess Thermal Comfort in Office Buildings in. International Journal of Environmental Research and Public Health Article
  64. Yahia, M. W., & Johansson, E. (2013). Evaluating the behaviour of different thermal indices by investigating various outdoor urban environments in the hot dry city of Damascus, Syria. International Journal of Biometeorology, 57(4), 615–630.
  65. Yao, R., Li, B., & Liu, J. (2009). A theoretical adaptive model of thermal comfort – Adaptive Predicted Mean Vote (aPMV). Building and Environment, 44(10), 2089–2096.
  66. Zacharias, J., Stathopoulos, T., & Wu, H. (2004). Spatial behavior in San Francisco’s plazas: The effects of microclimate, other people, and environmental design. Environment and Behavior, 36(5), 638–658.